Just Do Something - What's in the Colors (Updated)
A guide on how to interpret the colors of the buy/sell signals.
We wanted to update a Post we did back in August to shine some light on the Green and Red colors on the daily post and how they relate to the Sell and Add/Initiate signals. Based on comments we have received form some of our subscribers, we have simplified the colors and Zones to make it easier to follow.
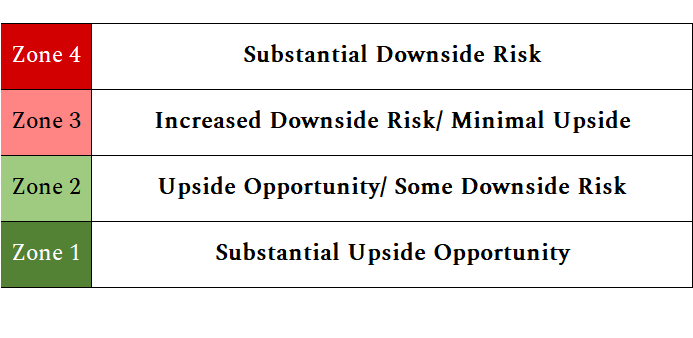
Most equity and ETF securities experience momentum moves. We track that momentum (price) and each time a security reaches a pre-determined Add/Initiate or Sell price, a signal is issued. We call it a “trigger”, and we number them. Sell trigger #1 represents a security that is coming off a down trend and has begun to move up in price. Sell trigger #2 is a Sell trigger price that represents an additional move to the upside, and so on. We convert these triggers into Zones. Sell Triggers 1-4 make up Zone 1 which means there is minimal downside and significant upside opportunity; Triggers 5-8 make up Zone 2 which means there is some downside risk but opportunity to the upside; Triggers 9-12 make up Zone 3 which means there is minimal upside opportunity and downside risk, Triggers 13 and higher make up Zone 4 which means there is significant downside risk.
We have also added a Relative Strength Indicator (RSI) to our signal technology to strengthen the quality of our signals. A RSI above 70 indicates an overbought (red) situation and a RSI below 30 (blue) indicates an oversold situation. A Zone 1 RSI 70 indicates there is potentially significant upside opportunity but short term the security may be overbought, conversely, a Zone 1 RSI 24 indicates there is potentially significant upside opportunity and the underlying security is in an oversold position. As with any rules-based strategy, trends can continue despite the underlying information.
We do not try to forecast the future price movement of the securities we follow. We strive to provide useful information as to where the market is at any given time. When our data indicates the security is overbought from previous price history, we send you a trim/sell signal. When our data indicates the security is oversold from previous price history, we send you an add/initiate signal. We are always selling into strength and buying into weakness.
Please remember, we don’t know where you are on your investment journey. You could be a trader using “The Investor’s Compass” to manage your buy or sells, you could be using the sell signals to reduce concentration in a single position, you could be using the “Sell” signals to raise additional cash, or you could be using the signals to help you better manage your portfolio by controlling emotions during volatility.
We have said many times, “It’s not about winning, it’s about not losing”. You never know in advance when momentum will switch over.
We are glad to be on this investment journey with you. Drop us a comment with how you are using DynaLogic or if you are enjoying our content, share it with a friend!
(Note: DynaLogic provides to subscribers relevant and real time market movement information on a host of equity securities. Signals (sell or buy) are based solely on mathematical changes in the price of a security. No other methodology is used.
DynaLogic is not a registered investment advisor, and it makes no representation or recommendation concerning the purchase or sale of any security investment product; DynaLogic provides no advice or recommendation whether a subscriber should or should not act on any signal a subscriber receives, and it has no knowledge whether a subscriber, in fact, acts on a signal or any signal; DynaLogic maintains no portfolio account or other investment information on any subscriber.)


