PayPal through the DynaLogic Lens
By the Numbers - A Case Study on How to Use Dynalogic to Minimize the Risk of Owning Individual Securities
On 7/23/21, PayPal stock (PYPL) closed at $308.53. By the end of the day on May 19th, 2022, less than a year later, PYPL was trading at $81.28 down 73.66%. What happened?
On 7/23/21, according to Bloomberg, there were no less than 53 analysts following PYPL, one of the darlings of the pandemic and Cathy Wood’s ARK Innovation. The distribution of analysts’ recommendations; 86.8% had a buy recommendation, 11.3% a hold, and 1.9% a sell. The 12-month price target ranged from $310 to $365 with the average 12-month price target $323.42.
Source Bloomberg
If you followed the analysts’ recommendations there was no reason to sell, maybe not buy more, but certainly not sell. In less than a year, an investor who owned PYPL on 7/23/21 was down almost 74% in value as of 5/19/2022. It’s going to take a 279.6% increase in the price of PYPL just to get back to the $308.53 July 23, 2021, closing price.
We here at DynaLogic continue to say you can’t forecast the future with a high degree of certainty but if you watch all the financial news channels, that’s what the pundits are trying to do. Interview after interview, telling us what they think is going to happen.
Let’s look at PayPal stock price through the DynaLogic lens. Let’s go back to June 1, 2020, and chart the sell signals?
The yellow line is the price of PayPal.
The red vertical lines indicate when DynaLogic issues a Sell signal.
Remember, all Sell signals are based on a predetermined, mathematical change in price that is established at the time of the previous sell.
There were a total of 20 sell signals over the 2-year period. Several of the Sell signals were at or close to an interim high. The all-time closing high for PYPL was $308.53 on July 23, 2021. DynaLogic issued a sell signal on July 13, 2021, at $302.97. If you examine the chart closely, there were never any sells when the price of PYPL was going down. DynaLogic only sells as prices are rising.
“Be greedy when others are fearful and be fearful when others are greedy”
Warren Buffett
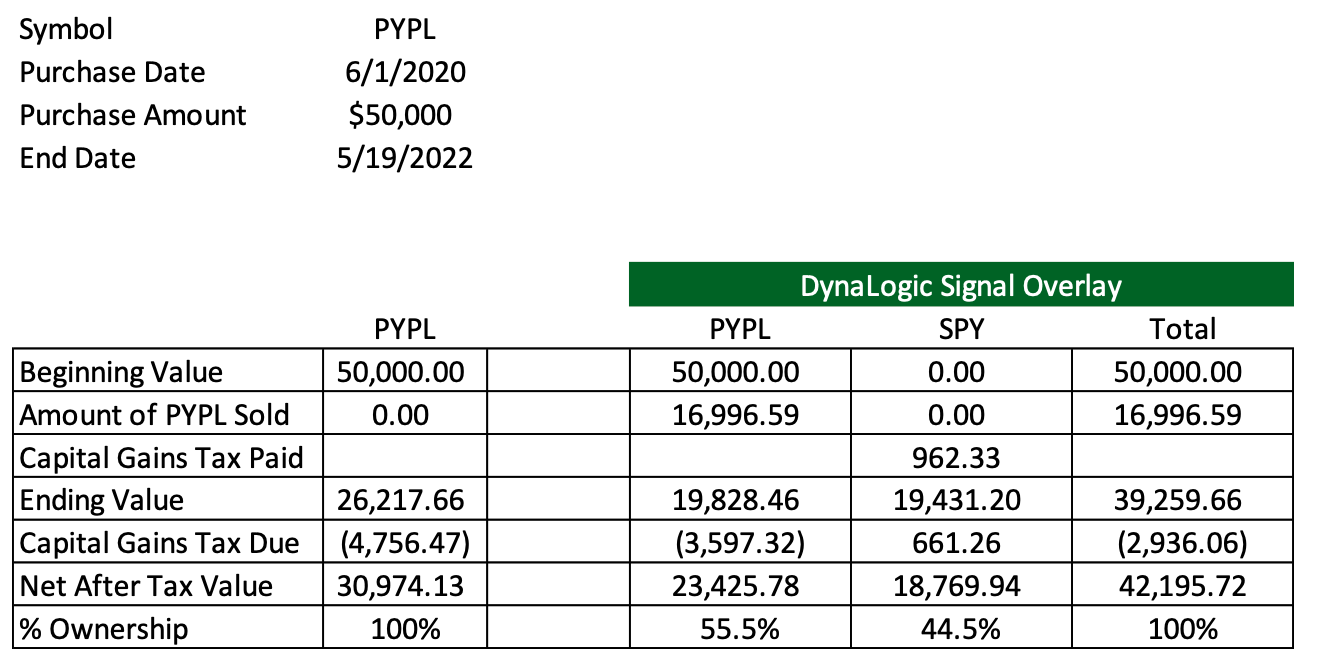
Let’s look at executing the sell signals on PYPL and taking the proceeds after paying any applicable capital gains tax and using the proceeds to buy the SPY-S&P 500 ETF.
For the period 6/1/20 to 5/19/22:
Scenario 1: Don’t sell PYPL
Ending value $26,217.66 plus a loss carryforward of $4,756.47.
Still own 100% PYPL.
Scenario 2: Sell PYPL using the DynaLogic Overlay and use the net proceeds after applicable capital gains tax to buy the S&P 500 SPY ETF.
Ending value $39,259.66 plus a loss carryforward of $3,597.32.
Ownership has been diversified; 55.5% PYPL, 44.5% SPY.
Improvement in performance 36.2%
The total return of PYPL from 6/1/2020 to 5/19/2022 is negative -47.40%
The total return of SPY from 6/1/2020 to 5/19/2022 is positive 31.23%
DynaLogic makes no attempt to predict the future. DynaLogic merely looks at the past and if there has been a sufficient change in price, a signal is issued. Completely rules-based and no emotion.
“Diversification may preserve wealth, but concentration builds wealth.”
Warren Buffett


