

Risk Off - Week in Review 4/24/2023
A weekly publication for all our subscribers summarizing market trends and recent signal highlights

We first want to say thank you for being a subscriber! We hope you will join our paid subscribers and benefit from our buy and sell technology to suit your risk profile and improve your investing results.
Market Summary
For the week, broad markets closed down slightly, 10 year treasuries yields rose and gold was down -1.13%.
Symbols in Bold are securities that are followed by DynaLogic
Monday-4/17 Beginning of earnings season. M&T bank up 7.7% on stronger than expected earnings. WBD up 7.2% on new streaming service. MRNA down 8.3% after results from its cancer vaccine trials. GOOGL down 2.7% as Samsung considering Microsoft Bing as the default search engine for its phones.
Tuesday 4/18- Big day for financials as BAC and GS (Goldman Sachs) reported and shares were down. JNJ was down 2.8% after posting earnings that beat expectations.
Wednesday 4/19- NFLX dropped more than 3% after slower subscriber growth. Declines in META and DIS both declined putting pressure on the Communications sector, and TSLA was off more than 2% after cutting prices. ABT shares rose 8% after better than expected revenues and ISRL (being added this week) up more that 10% on growth of its robotic surgical systems.
Thursday- 4/20- TSLA shares sank after reporting price cuts and lower profits. Shares of other EV companies lost grown to include RIVN , F, and GM. Shares of T dropped more than 10% on subscriber base and VZ moved lower.
Friday 4/21- PG rose more than 3% after reporting strong results. Shares of HD, LOW and KMB (Kimberly-Clark) also rose. Financial sector was hard hit sending USB (US Bank) TFC (Truist) and RF (Regions) posted losses.
Information provided by Investopedia
Best trades of the week
Buy NVAX at $8.23 on 4/18/23 closed the week at $8.68 up 5.47%
Buy PTON at $9.08 on 4/20/23 closed week at $9.48 up 4.41%
Buy T at $17.65 on 4/20/23 closed week at $18.22 up 3.23%
Sell ABNB at $120.1 on 4/19/23 closed week $115.5 down -3.83%
Sell PM at $101.33 on 4/18/23 closed week at $97.77 down -3.51%
Trades that aren’t working out so far (we aren’t perfect)
Buy VLO at $122.95 on 4/20/23 closed week at $119.63 down -2.70%
Buy COIN at $60.5 on 4/20/23 closed week at $59.04 down -2.41%
Acting on any of these best trades of the week could have easily covered months if not years of a DynaLogic subscription. If you aren’t yet a full member, upgrade now with a 7 day free trial and start benefiting from the results our subscribers have seen on these signals!
Editor’s Corner
From time to time we will post topics that we believe are relevant to today’s market environment.
Most recently, several economists have included a discussion about stagflation in their comments. Not seen since the 1970’s and the oil embargo, the U. S. economy is experiencing several of the factors that can cause stagflation.
What causes Stagflation?
*Credit to Chat.openai.com
Stagflation can be caused by a variety of factors, including:
Supply-side shocks: These are sudden disruptions to the supply of key resources or inputs, such as oil or raw materials, which can cause the prices of these goods to rise sharply. This can lead to a decrease in aggregate supply and an increase in costs, which can lead to both inflation and stagnation.
Structural imbalances: These refer to long-term issues in the economy that can contribute to stagflation. For example, if there is a lack of investment in productivity-enhancing technology or if there are bottlenecks in the supply chain, it can limit the ability of the economy to grow and expand. This can lead to a situation where unemployment remains high, while prices continue to rise.
Monetary policy mistakes: In some cases, central banks may make errors in their monetary policy decisions, which can contribute to stagflation. For example, if the central bank keeps interest rates too low for too long, it can lead to excessive borrowing and inflation, while also discouraging investment and slowing down growth.
Fiscal policy mistakes: Similarly, if the government engages in unsustainable fiscal policies, such as running large budget deficits or implementing excessive regulations, it can also contribute to stagflation.
During the 1970’s the equity market as measured by the S&P was negative -1% on a real rate of return basis when factoring in inflation. Inflation averaged 7.4% and the total return for the S&P was 5.8%. Some people called it the lost decade for the equity market. But during the period, there were wide swings in the equity market both to the upside and downside.
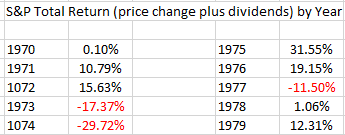
If you sold in 1971 and 1972 while the market was rising and bought back in during 1973 and 1974, you would have caught the big run up and sold again in 1975 and 1976 to prepare for the downdraft in 1977. This approach would have outperformed a buy and hold strategy. This pattern of buying and selling at timely moments is exactly what DynaLogic provides in an unemotional way with its buy and sell technology.
Are we entering a period of stagflation? Probably not to the degree of the 1970’s, but when you look at the 4 bullets mentioned above, all are being played out today in real time.
Ready to get full access to DynaLogic, upgrade today with a 7 day free trial to get full access to our buy & signals. Invest better with DynaLogic.
When was the last time the United States faced stagflation
The United States experienced stagflation during the 1970s, particularly in the years following the 1973 oil crisis. During this period, the country faced a combination of high inflation, stagnant economic growth, and high unemployment rates, which posed a significant challenge to policymakers.
The stagflation of the 1970s was caused by a combination of factors, including rising energy prices, a decline in productivity growth, and expansionary monetary and fiscal policies. It took several years for the U.S. economy to recover from this period of stagflation, with policymakers implementing a range of measures to reduce inflation and stimulate growth.
Since then, the U.S. economy has not experienced a period of stagflation on the same scale as in the 1970s. However, there have been periods of economic slowdown and high inflation, such as during the early 1980s and the late 2000s, which some economists have characterized as "stagflation-lite."
Thanks for the comment. Let's hope the rest of the decade doesn't look like the 70's but there are a lot of similarities. The DynaLogic platform is well positioned to support the investor if it does.
Excellent Information, especially on stagflation.