

"The Investor's Compass" - Powered by DynaLogic for 12/13/23
"The Investor's Compass" - Powered by DynaLogic for 12/13/23
We include RSI (Relative Strength Indicator) in Our Signals. S&P up .46%, the Dow up .47%, and the Nasdaq up .80%. Treasury yields down slightly and gold was basically flat.
Today we are introducing the Relative Strength Indicator (RSI) to complement our Add/Initiate and Sell signals. While we have been pleased with the overall performance & quality of our signals, occasionally the timing on some signals has been off. After experimenting with layering in RSI data, we saw it further improved our system’s performance, and wanted to make it easier for our subscribers to find our most actionable signals.
We believe the combination of our signals coupled with a Relative Strength Indicator will lead to better portfolio management and improved trading.
What is the Relative Strength Indicator?
Relative Strength Indicator (RSI), developed by J. Welles Wilder, is a popular momentum oscillator that is commonly used in technical analysis to identify overbought or oversold conditions in a financial market. It is a range-bound oscillator, typically oscillating between 0 and 100, and is calculated using the average gains and losses over a specified time period. The formula for calculating RSI is:
RS (Relative Strength) is the average of 'x' days' up closes divided by the average of 'x' days' down closes.
The most common time frame for RSI calculations is 14 periods.
Understanding RSI:
1. Overbought and Oversold Levels:
· Traditionally, and according to Wilder's original interpretation, an RSI above 70 indicates that a security may be overbought, and an RSI below 30 indicates it may be oversold.
· Overbought conditions suggest that the security may be due for a price correction or reversal downward.
· Oversold conditions suggest that the security may be due for a price bounce or reversal upward.
For more on RSI, check out yesterday’s post.
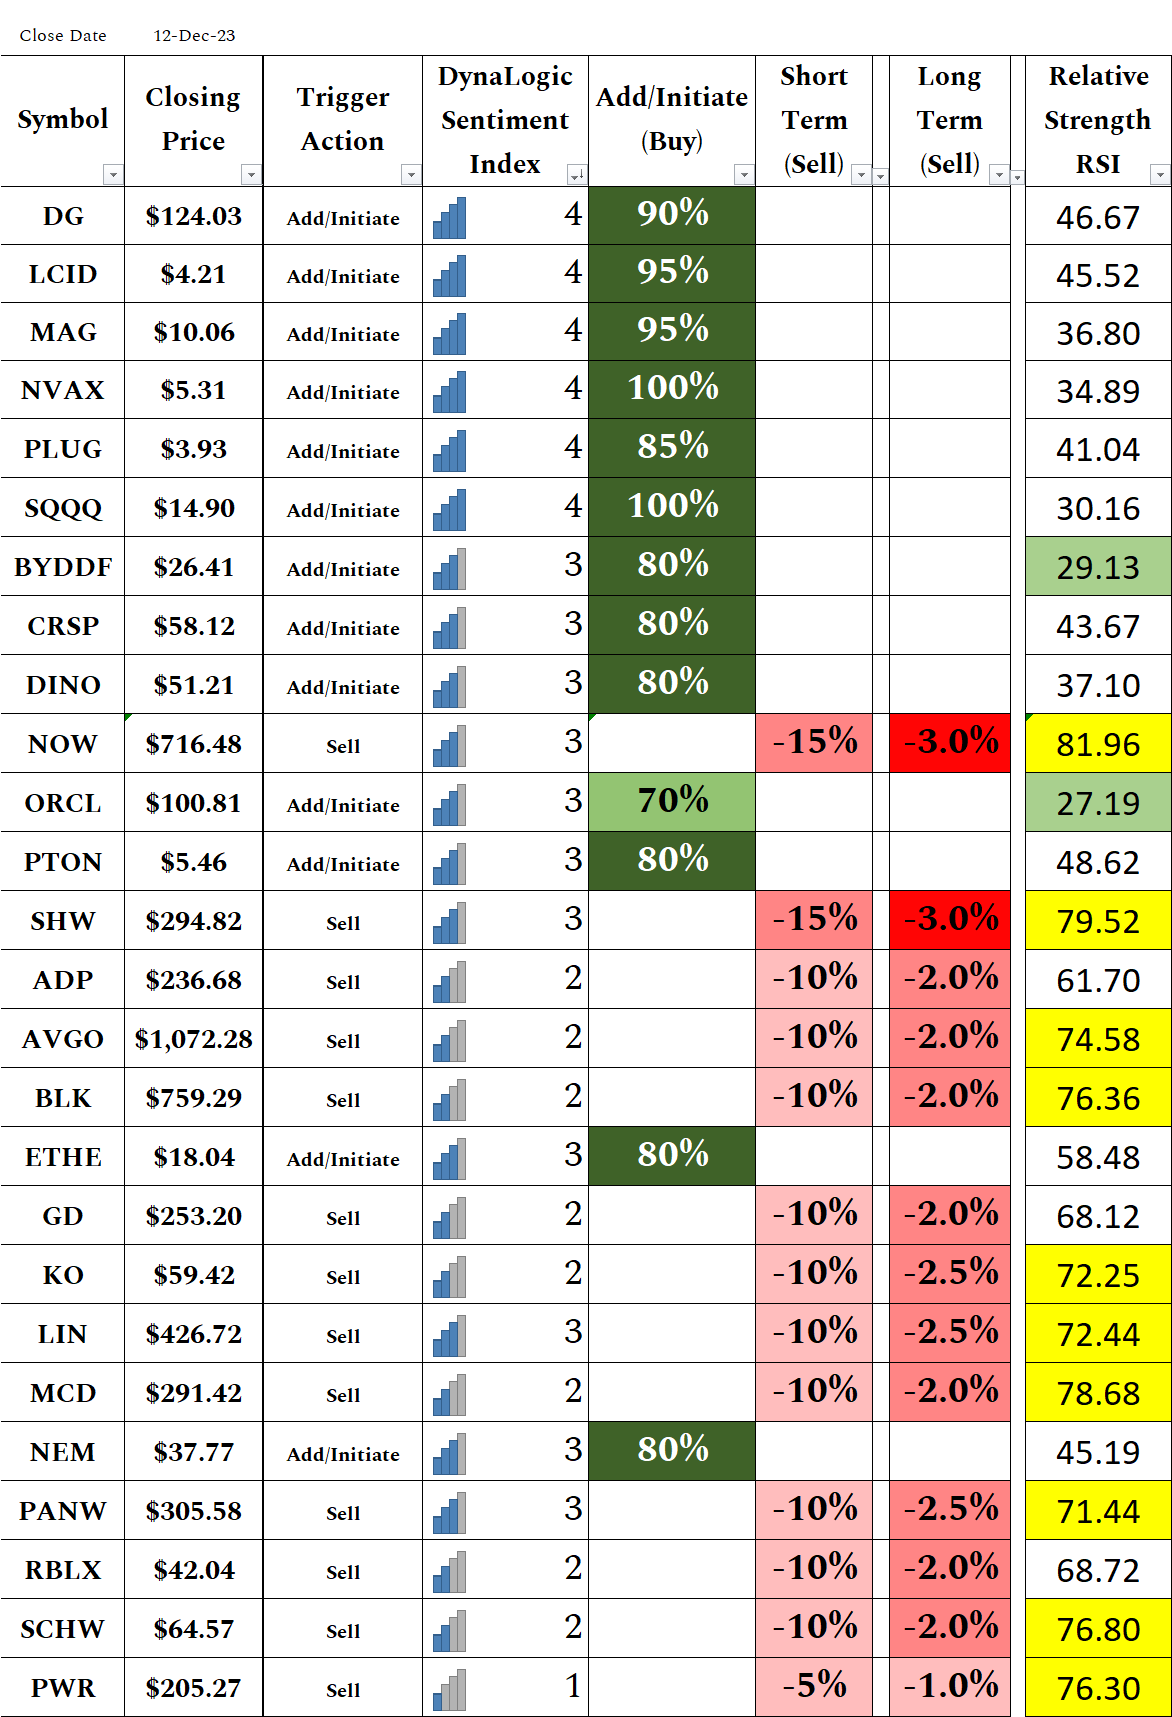
In our signal table below, we have highlighted in yellow the signals meeting the criteria for overbought or an RSI over 70 and green for oversold or an RSI below 30. Stocks meeting this criteria, especially when combined with a strong signal, are the ones our system view as most likely to experience a reversal and signals our subscribers should pay special attention to.
Have feedback or questions? Drop us a comment below.
For a full list of the 260+ securities we are tracking, which include individual securities, cryptocurrency, Index and Sector ETFs and more, refer to our Security offering sheet.
For a full list of the next buy and sell signals which includes the Relative Strength Index, click here.
If you would like to contact us directly, send an email to support@dynalogic-signals.com We will be happy to answer any of your questions and would welcome comments or suggestions.
If you are a new paid subscriber, for help understanding how DynaLogic works and how to properly use our system, head to this post which explains how DynaLogic works and answers some common questions.
This post is for paid subscribers but want to help your friends invest more intelligently too? Please Share “Risk Off” so they can become a subscriber