


"The Investor's Compass" - Powered by DynaLogic for 1/31/24
"The Investor's Compass" - Powered by DynaLogic for 1/31/24
Announcing significant improvements to our signal technology, designed to make using our system to enhance your investing returns easier than ever before.

Editor’s Note: We have seen enormous growth in the data we manage to produce our daily posts and support our subscriber base. The time has come to upgrade our software systems and our data (cloud) storage. We will not be producing a daily post after Tuesday morning’s post (1/22/24) and will resume on Monday the 29th. Thanks for your patience while we prepare “The Investor’s Compass” for smooth sailing in 2024 and beyond.
Market Update-
Broad markets were mixed today Dow up .31%, The S&P off -.08%, and the Nasdaq off -.67%. Treasury yields were lower and gold was slightly higher.
Key Trade Alerts: RSI-Filtered Signals
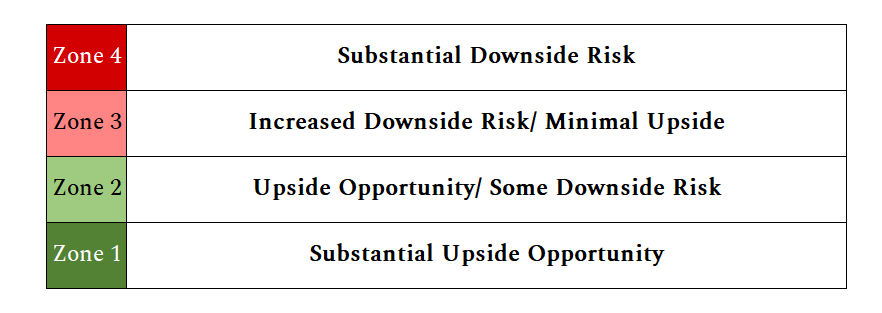
We've fine-tuned our signal table to simplify our Zone information. We now show four Zones ranging from Substantial Upside Opportunity to Substantial Downside Risk. This simplified process should allow you to better position your investments going forward. Additionally, on our daily posts, we will be highlighting the most actionable opportunities. These are securities that had a Sell or Add/Initiate signal, and a Relative Strength Index (RSI) that was either overbought (above 70 in yellow) or oversold ( below 30 in blue). These are the trades our system has identified as having a higher probability for an upcoming change in price direction.
Please note, a Zone 1 with a RSI of 33, while not in an “oversold” position, indicates there is substantial upside opportunity but may see some price depreciation in the short term and a Zone 4 with a RSI of 68, while not in an “overbought” position, still indicates there is substantial downside risk. Sometimes securities never reach an “oversold” or “overbought” RSI position during market cycles but a change in the direction of the price occurs. By combining our zone technology with the Relative Strength Index, we are confident our subscribers can easily pinpoint trades to execute with the highest probability of success.
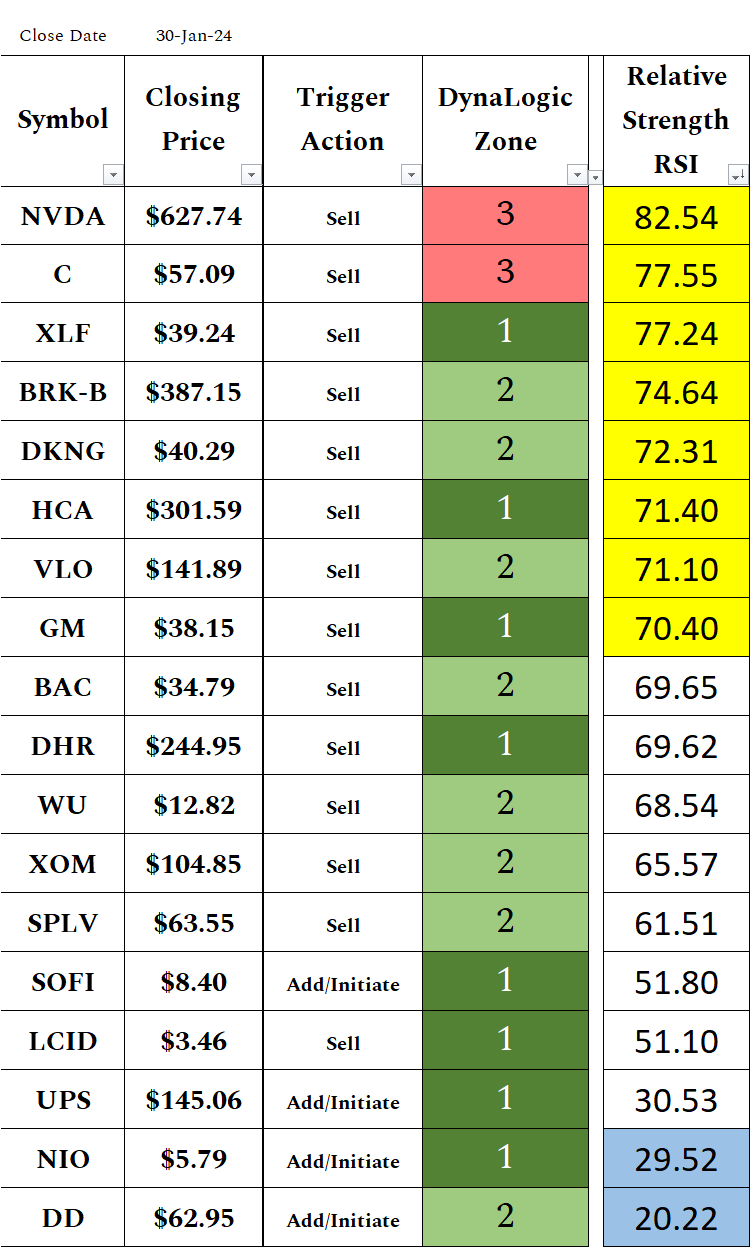
What’s more, we have changed the sheet with our next buy & sell signals to now show the current zone and RSI of all of the securities we are tracking. We have realized that some of our subscribers may not find it feasible to consistently check our daily signals email, identify trades they wish to execute, and execute on them. We are confident this new sheet will be an invaluable resource, by allowing you to get a feel for “what DynaLogic says” about any stock you own or are monitoring at any time, not just when there is a signal. That way when you have time to dedicate to portfolio management, it is easy to identify stocks you may want to trim, or identify high probability buying opportunities.
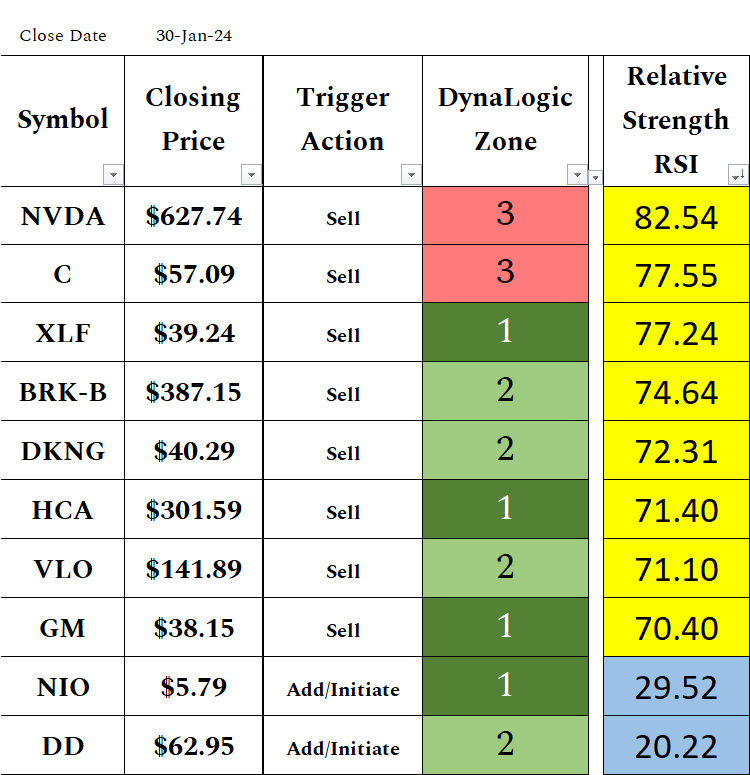
NIVIDIA (NVDA)- DynaLogic issued an Add/Initiate signal on 10/26/23 at the closing price of $403.26. Stock is up 55.6%.
Citigroup (C)- DynaLogic issued an Add/Initiate signal on 10/25/23 at the closing price of $38.61. Stock is up 47.9%.
Financial Select Sector SPDR ETF (XLF)- DynaLogic issued an Add/Initiate signal on 3/15/23 at the closing price of $31.41. Stock is up 24.9%
Berkshire Hathaway Inc (BRK-B)- DynaLogic issued an Add/Initiate signal on 10/27/23 at the closing price of $331.71. Stock is up 16.7%
DraftKings Inc (DKNG)- DynaLogic issued an Add/Initiate signal on 1/3/24 at the closing price of $32.21. Stock is up 25.1%
HCA Healthcare (HVA)- DynaLogic issued an Add/Initiate signal on 10/26/23 at the closing price of $257.14. Stock is up 17.3%.
Valero Energy (VLO)- DynaLogic issued an Add/Initiate signal on 11/9/23 at the closing price of $119.92. Stock is up 18.3%
General Motors (GM)- DynaLogic issued an Add/Initiate signal on 10/27/23 at the closing price of $27.22. Stock is up 40.1%.
NIO Inc (NIO)- DynaLogic issued a Sell signal on 12/28/23 at the closing price of $9.43. Stock is down -38.6%
DuPont de Nemours (DD)- DynaLogic issued a Sell signal on 12/19/23 at the closing price of $74.12. Stock is down -15%.
While these are some of the securities that met a pre-determined price objective, and are in an overbought or oversold position, market trends can continue beyond expectations. That's why it’s crucial to pair these insights with additional analysis and solid risk management. Our focused approach aims to cut through the noise, giving you clear signals when it might be time to make a move.
This is just a snapshot of the information available. We update all 260+ securities each night with current Zones and RSI. Sign up for paid so you can get all the current information.
Here are all of today’s signals with their RSI reading
Have feedback or questions? Drop us a comment below.
For a full list of the 260+ securities we are tracking, which include individual securities, cryptocurrency, Index and Sector ETFs and more, refer to our Security offering sheet.
For a full list of securities with the updated Zone strength and the current Relative Strength Index, click here.
If you would like to contact us directly, send an email to support@dynalogic-signals.com We will be happy to answer any of your questions and would welcome comments or suggestions.
If you are a new paid subscriber, for help understanding how DynaLogic works and how to properly use our system, head to this post which explains how DynaLogic works and answers some common questions.
This post is for paid subscribers but want to help your friends invest more intelligently too? Please Share “Risk Off” so they can become a subscriber