


Daily Buy/Sell Signals Email - 1/3/23
Daily Buy/Sell Signals Email - 1/3/23
DynaLogic doesn't try to predict the future, DynaLogic prepares you for the future.

Please continue to help us grow by clicking on SHARE at the bottom of this page. We thank you in advance for your support!
Buy & Sell Actions- When we post Buy or Sell actions, DynaLogic is not making a recommendation to buy or sell because we don’t know your investment goals, risk tolerance, etc. That would be like asking us for directions when we don’t know where you are going. When we post buy and sell signals, we are advising you that there has been a meaningful price change from the previous signal and a new price objective has been reached. We are tapping you on the shoulder saying you might want to “take some chips off the table” (sell) or invest in or add to a position (buy) and suggest the amount of the Buy or Sell. DynaLogic doesn’t try to predict the future; DynaLogic instead prepares you for the future.
Buy Action Example: Let’s assume you want to invest in Amazon (AMZN), and let’s assume we post a Buy signal of 35% for AMZN. Based on the signal technology, we are saying invest up to 35% of money available for AMZN. If you are already fully invested in AMZN, no further action is warranted. If on the other hand you had 25% of the money available for AMZN invested, then you should consider increasing the investment by an additional 10%.
Sell Action Example: If we post a Sell signal to Sell (-1.3%) of AMZN, we are advising, that based on the signal technology, it would be appropriate to sell (-1.3%) of your position in AMZN. Of course you are free to sell more or less or pass on the suggested trade.
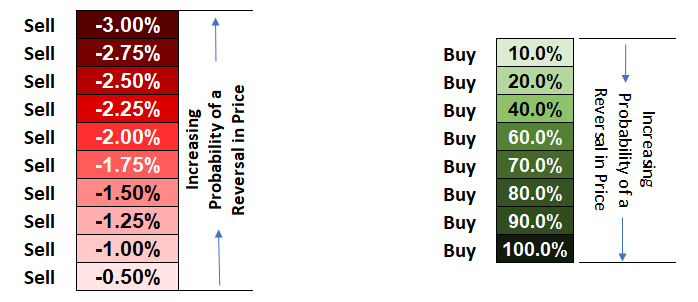
100%: When a Buy signal reaches 100% it generally represents a 40% decline in the price of the security from an all-time high or from a significantly higher price. During bear markets, a security can continue to decline in price far beyond 40%. As the price of a security continues to decline towards the 100% buy signal, the investor is advised (small red flag)

to use caution and do some additional research. It may well be the company fundamentals have declined significantly and more price decline is probable. As always when a signal is issued, DynaLogic is just tapping you on the shoulder posing the question, "Should you be doing something".
In addition to using price movement to detect price trends and generate buy and sell actions, DynaLogic uses colors to indicate the probability of a reversal in price. All securities experience price trends. Though no guarantee, the darker the color the deeper/longer the trend and the greater the probability of a change. The darker the color the stronger the statement to “do Something”.
For more information how to interpret the colors and percentages of the daily buy/sell signals, please read this post.
If you’re a new subscriber, for more information on how to use our daily price signals and the logic behind DynaLogic, see the post here or head over to our Risk-Off Question & Answer discussion where we answer your top questions.
For a full list of the securities we are tracking, which include individual securities, cryptocurrency, ETFs and more, refer to our Signal Offerings Reference sheet found here.
For a full list of the next buy and sell signals click here.
Want to help your friends invest more intelligently too? Share Risk Off with a friend.